I kept building tools to watch my AI agents
Three takes on the same itch: when an agent does something weird, I want to see exactly what it sent and got back.
Every time I work with coding agents, I hit the same wall. Something goes sideways, and I have no real idea what the model actually saw. You get the output, not the conversation that produced it. So I kept building variations of the same tool: a way to watch the traffic. Three of them, and the shape kept shifting as I went.
llm-trace
It started with llm-trace. Rather than instrument a single tool, it is a local gateway
that traffic routes through, with a trace viewer on top. It redacts secrets, and it lets me
replay a session to see how it unfolded. This was the version for when “show me the last
call” grows into “let me understand this whole multi-step run.”
llm-inspector
Then I pivoted to llm-inspector, a proper desktop app built around a turn-based view of a
session. The feature I wanted most here was comparison: put two requests side by side and
see what changed. When an agent works on one prompt and fails on a nearly identical one,
the diff is where the answer usually hides.
agent-kit
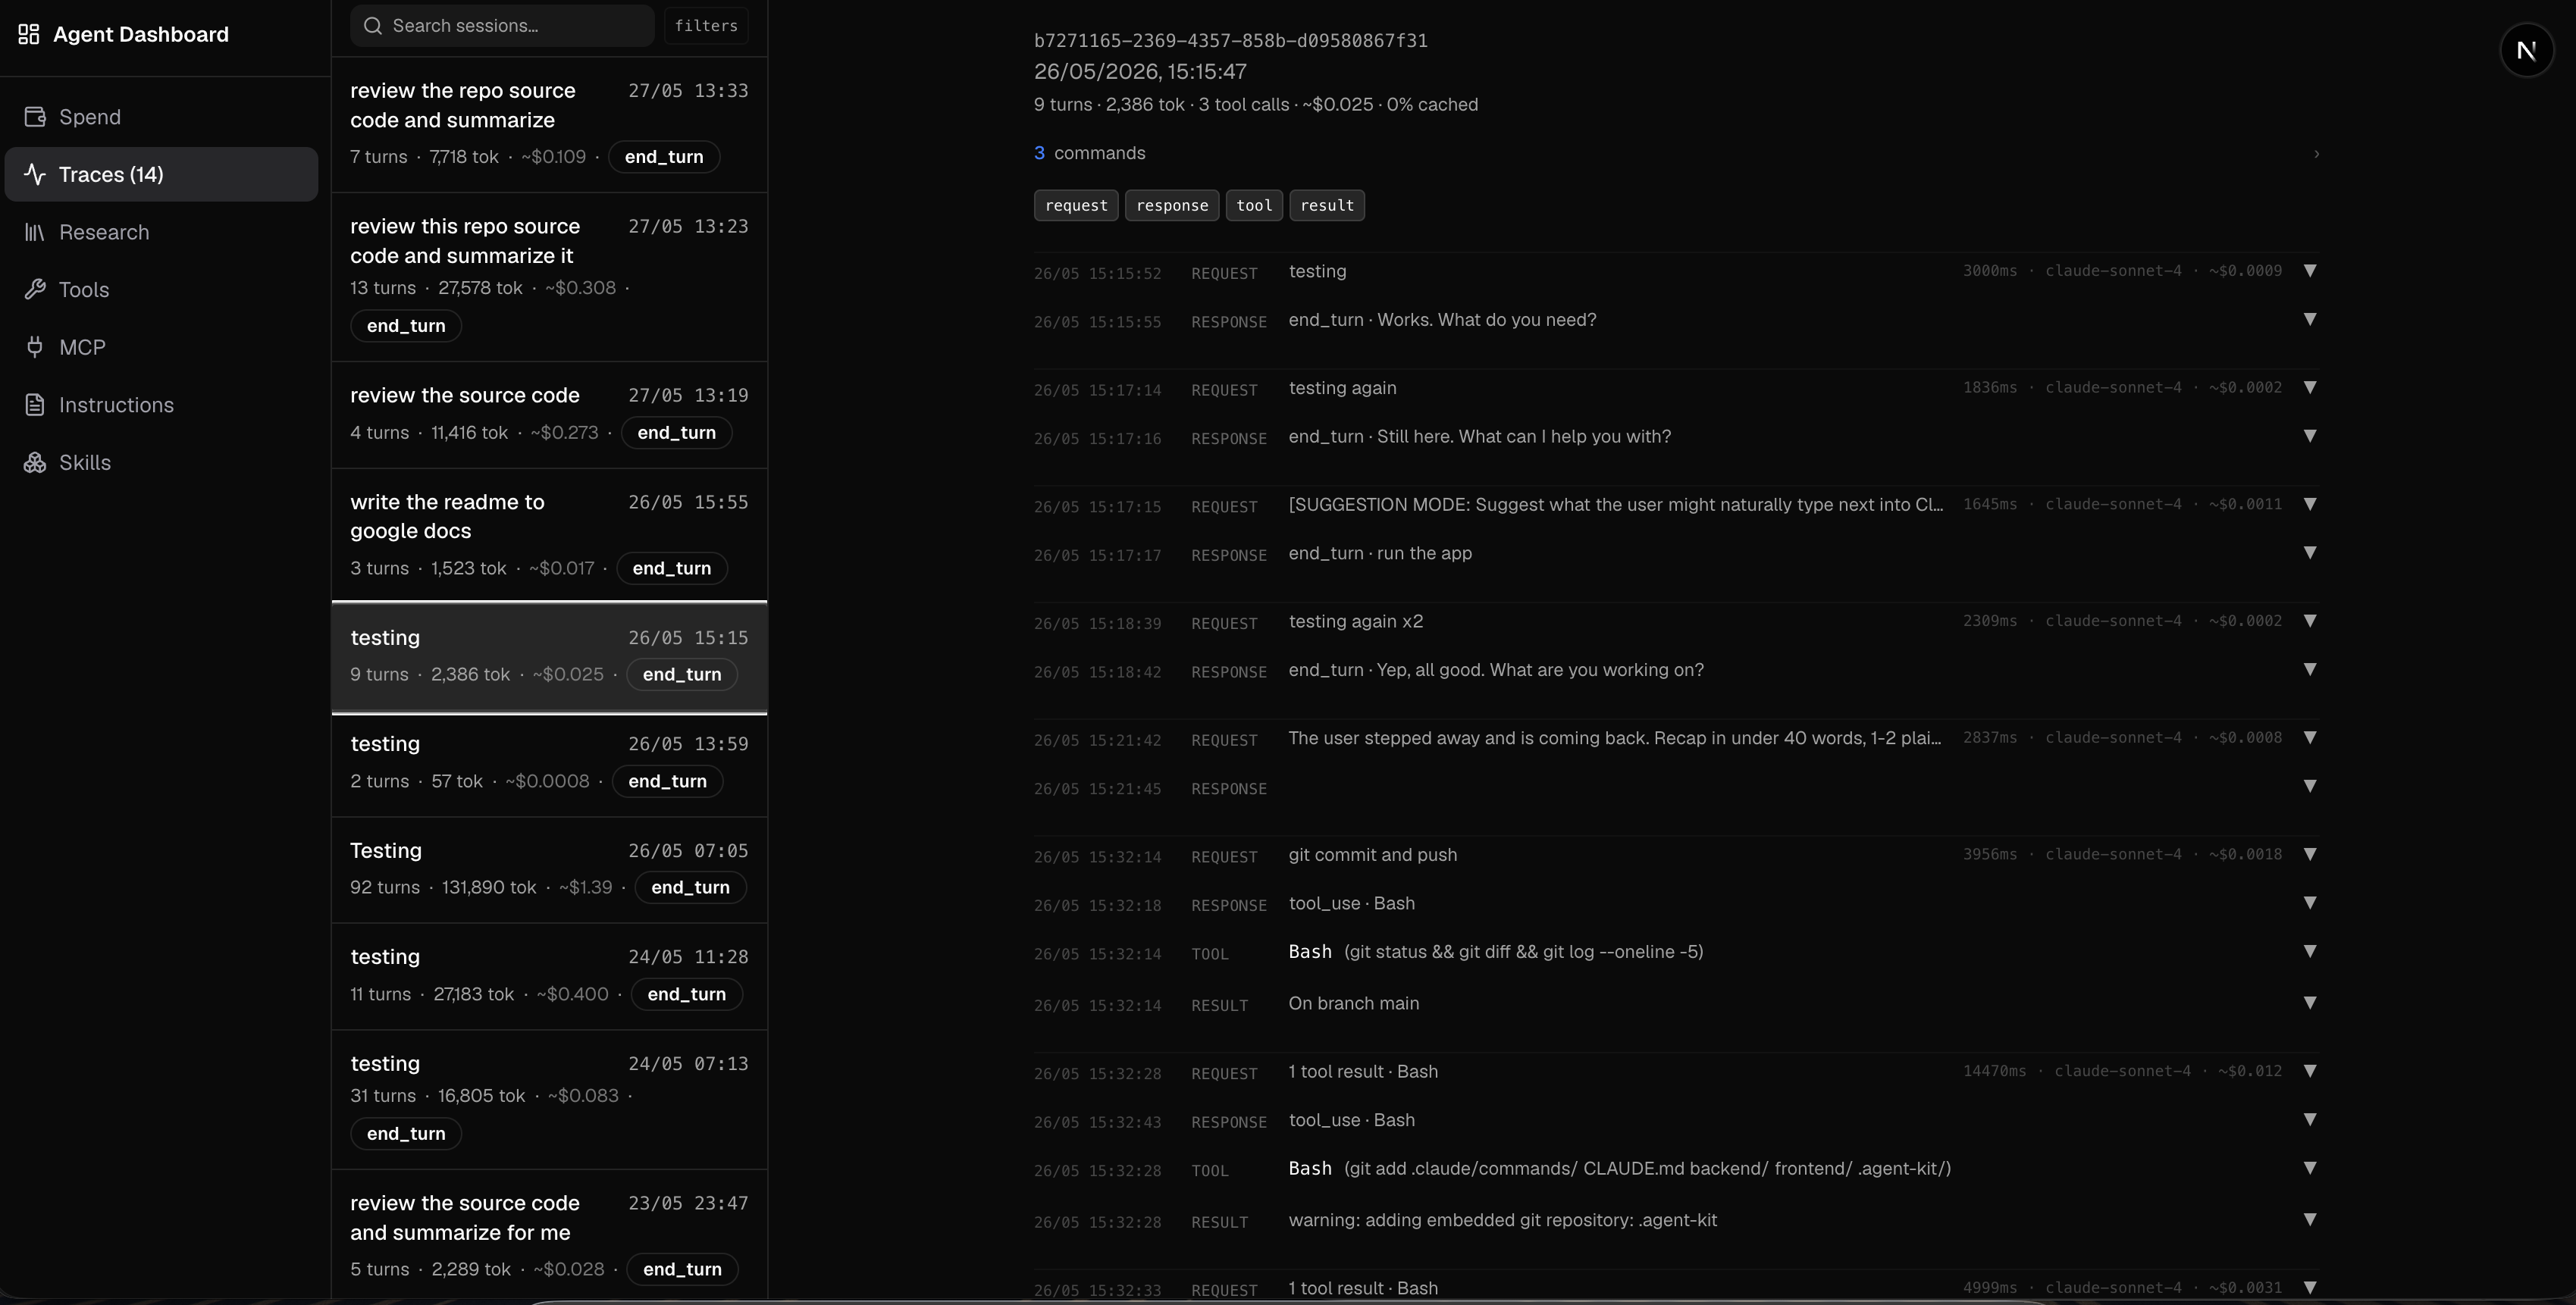
Eventually it generalised into agent-kit, and this is the one I actually use day to day.
It puts a local proxy in front of Claude, records every API call, and surfaces them in a
dashboard. You run agent-kit trace, it spawns the proxy and launches Claude, and from
then on every request and response is captured. Git hooks index things automatically so I
do not have to think about it.
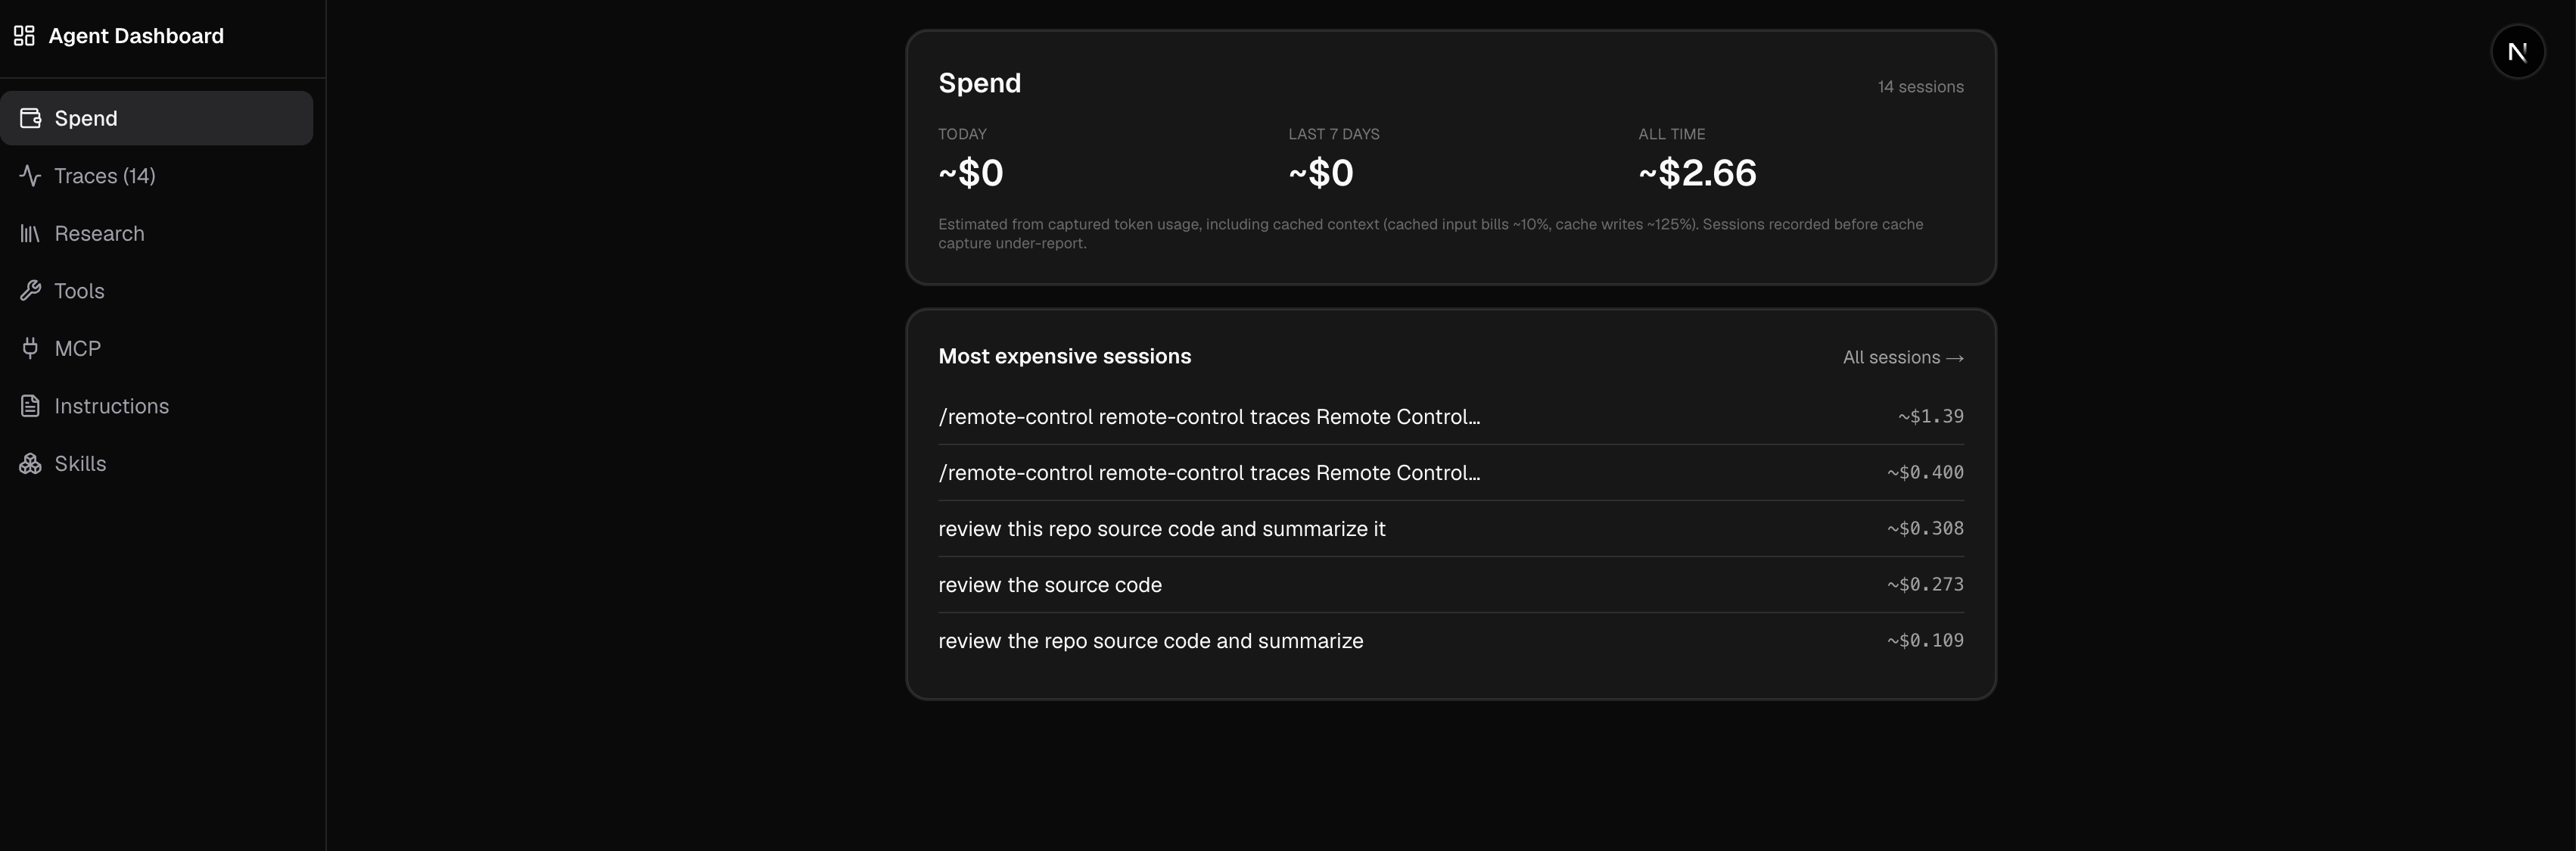
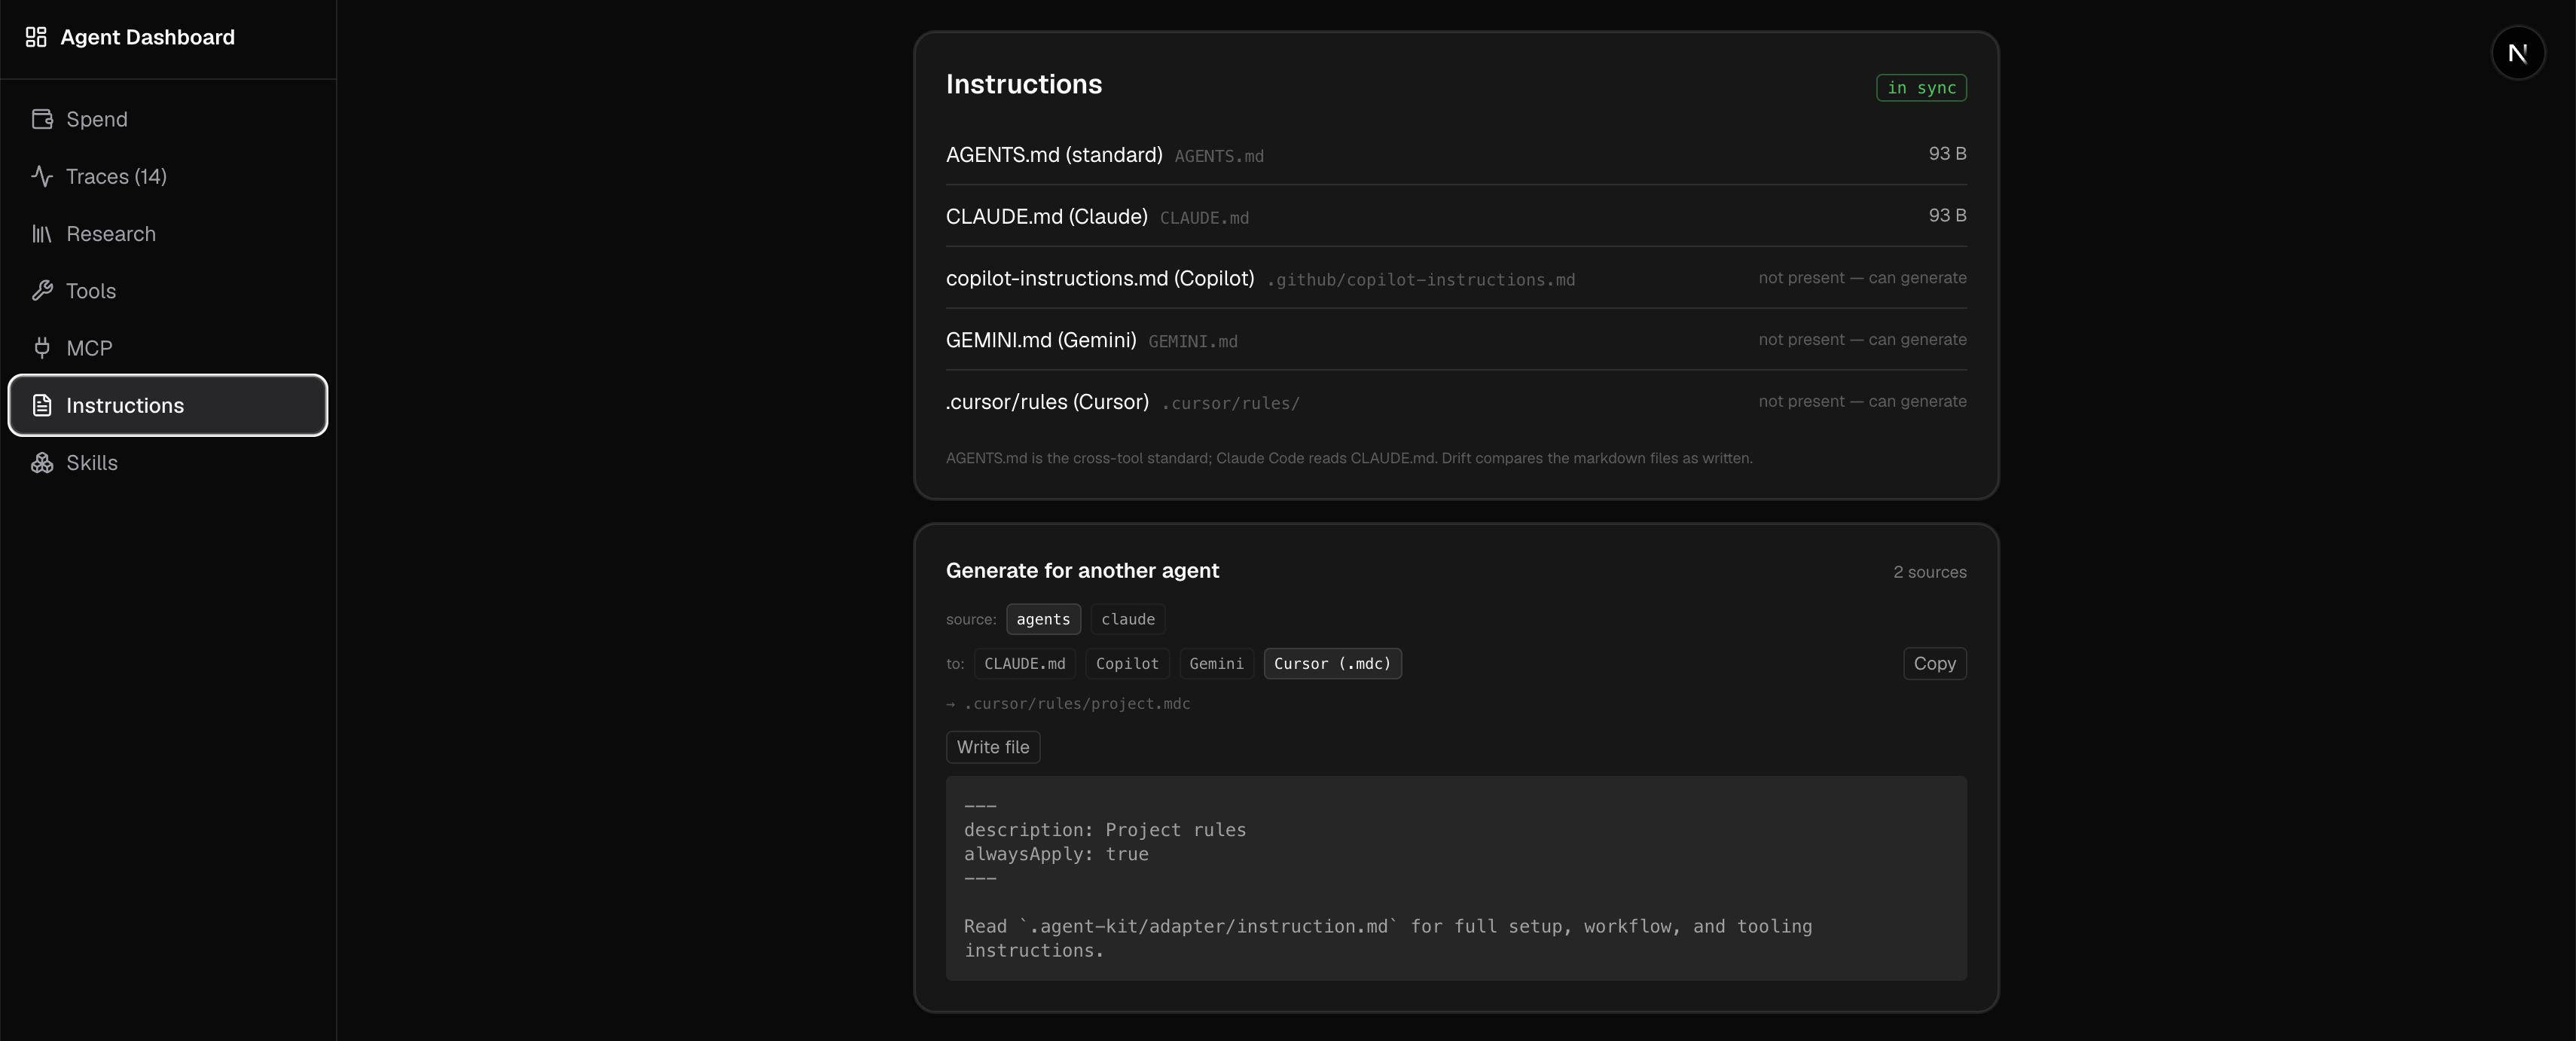
The dashboard turned into more than a flat list of calls. It groups traffic into sessions and estimates what each one cost from token usage, so I can see spend for today, the last seven days, and all time, and which sessions were the expensive ones. That alone changed how I work. Watching a single session quietly run up a dollar is a fast way to notice an agent stuck in a loop. Alongside the cost view it lets me browse the traces themselves and pulls out the other things a run touches: the tools it called, the MCP servers, the instructions it was given, the skills it used.
The whole design goal was low friction. If checking “what did the last call look like” or “why did that session cost a dollar” takes more than a few seconds, I will not do it, and then I am back to guessing.
It is local first. Everything sits on my machine. There is also a small backend I built,
agent-hub, that the kit can optionally push traces to so they live somewhere central
rather than only on one laptop, but the local dashboard is the part I actually use day to
day.
Building the same thing three times
I did not set out to build three tools. Each one started because the previous one did not quite fit the next situation, and the idea kept getting more general: a gateway, then a desktop app, then a proxy that just sits there and records. Doing it three times taught me what the actual feature is, and it is not the dashboard or the desktop UI or the gateway. It is reducing the friction of seeing the last call to almost zero, and keeping all of it local so I never think twice about routing my traffic through it.
Agents are opaque by default. A surprising amount of “this AI is being dumb” turns out to be “the AI saw something different from what I assumed.” You only find that out if you can look.